米国:生産者物価指数:2020年2月


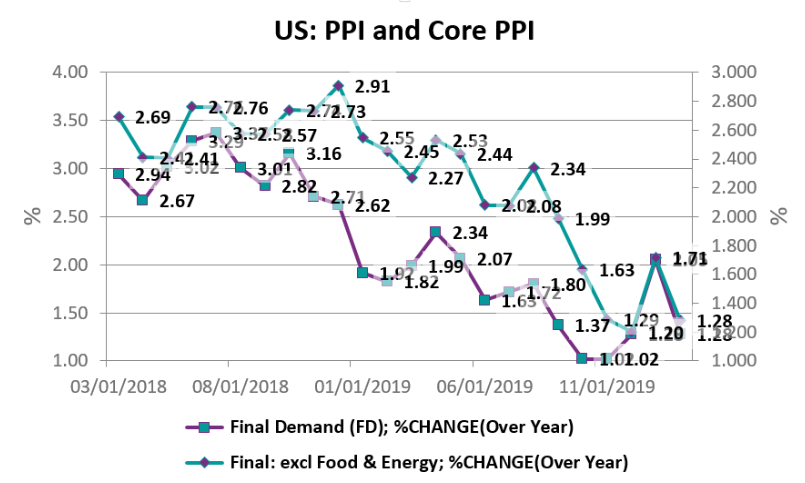
The Producer Prices Index (PPI) in the US grew at a slower rate in February 2020. The seasonally adjusted PPI recorded a 1.28% y/y growth compared to 2.05% increase in January 2020. The indicator went back to the figure it recorded in the final month of 2019, which was the lowest since November 2016. The February move essentially puts a break on the acceleration in the producer prices in the US, observed in December 2019 and January 2020.
The core PPI followed the same moves, as the indicator, which excludes food and energy prices, grew by 1.28% y/y in February 2020, compared to a 1.71% increase in January. The next months will determine if any trend, upward or downward, will be established. This is crucial since the PPI usually suggests how the Consumer Prices Index would move.

Detailed data and analysis on the US economy can be found in the CEIC US Economy in a Snapshot – Q4 2019.