中国 工業稼働率上昇

Compared to the same time last year, the indicator increased by 0.3 pp
China’s industrial capacity utilisation rate was up by 2.4 pp to 76.7 in Q3 from 74.4% in Q2. Compared to the same time last year, the indicator increased by 0.3 pp and surpassed that of the pre-pandemic level.
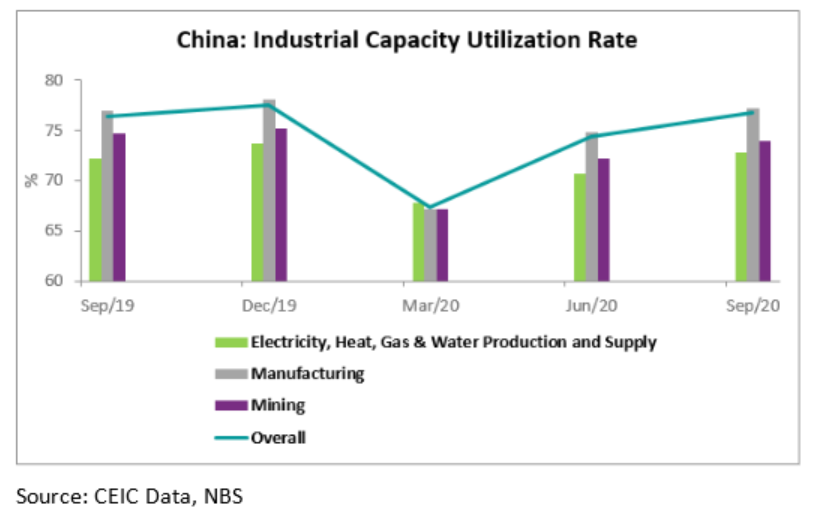
Among all the three categories, in Q3, manufacturing is the only one that performs better than the overall indicator. The industrial capacity utilisation rate in the mining and in the electricity, heating, gas & water production and supply both stay below overall rate and below the pre-pandemic levels.
Further data and analysis on China’s economy is available on the CEIC China Economy in a Snapshot – Q4 2020 report.